
Learning Analytics
Goals
As a lecturer, have you ever wondered about the hidden dimensions of student learning? While you stand in front of the class week after week, teaching and answering questions, the students' learning activities outside the classroom remain largely invisible. How many hours do students invest in learning? How frequently do they review course materials? How often do they attempt self-assessment tasks? The complexity of understanding students' diverse learning behaviors has intensified with the increasing number of students in higher education and the proliferation of eLearning formats. Traditional teaching approaches struggle to provide comprehensive insights into individual learning processes.
At the same time, students are also increasingly interested in understanding their academic performance relative to their peers and where their strengths and weaknesses are situated. Providing students with insights on these topics could also prove intrinsically motivating. Students seek to know: Have they completed self-learning modules? How do their formative assessment results compare to classmates?
Learning Analytics offers a sophisticated solution to these challenges. Defined by Long et al. (2011) as "the measurement, collection, analysis, and reporting of data about learners and their contexts, for purposes of understanding and optimizing learning and the environments in which it occurs", this emerging field provides unprecedented visibility into educational engagement. The integration of online and blended learning has exponentially expanded the volume of educational data available. As Stewart (2017) highlighted, these data repositories serve as a foundational resource for analyzing student behavior, identifying improvement opportunities, and enhancing teaching and learning processes. Learning Analytics enables lecturers to gain nuanced insights into actual student learning patterns while simultaneously providing students with a comparative perspective on their academic performance. By transforming complex data into meaningful insights, this approach enhances our understanding of educational engagement.
Background
In higher education, understanding students' diverse learning behaviors and engagement levels is crucial for lecturers aiming to enhance their teaching practices (Volungevičienė et al., 2019). However, the growth in student numbers has reduced opportunities for meaningful interactions, making it challenging for lecturers to fully grasp students' learning processes (Lowes, 2020). The integration of online and blended learning further amplifies this issue by generating vast amounts of educational data (Stewart, 2017). This data serves as a foundation for analyzing student behavior, identifying areas for improvement, and providing targeted support (Büching et al., 2019).
Recognizing these challenges, Learning Analytics (LA) has emerged as a powerful tool to transform educational data into actionable insights. LA facilitates a shift towards evidence-based educational strategies, benefiting students, lecturers, and administrators by creating more effective and personalized learning experiences.
One of LA's significant contributions lies in its ability to objectively assess student engagement, moving beyond traditional self-reports and surveys (Caspari-Sadeghi, 2022). By automatically tracking digital activities, LA provides lecturers with insights into students' knowledge levels, error patterns, and engagement, enabling them to adjust course designs and teaching methods effectively (Tervakari et al., 2014; Hui & Farvolden, 2017). LA also uncovers learning behavior patterns that may hinder effective learning (Tervakari et al., 2014). For instance, it can detect activity spikes near assignment deadlines and exam periods (Hui & Farvolden, 2017; Poon et al., 2017; Tervakari et al., 2014). As Tervakari et al. (2014) observe, such trends often leave insufficient time for peer discussions and result in an inadequate understanding of course materials. Recognizing these patterns enables lecturers to adjust course designs, such as introducing more structured peer-learning opportunities earlier in the semester.
Insights into student learning behavior provide a crucial foundation for the critical reflection of lecturers, allowing them to evaluate and reconsider course materials, future course implementations, and pedagogical practices (Chatti et al., 2012; Karademir et al., 2021; Redmond et al., 2018). Based on this foundation, Learning Analytics supports lecturers in decision-making regarding adjustments in both current and future course implementations (Volungevičienė et al., 2019). According to Ifenthaler (2020), such reflections contribute to the professional development of educators in higher education.
LA also plays a crucial role in identifying at-risk students, allowing for proactive interventions. As noted by Tervakari et al. (2014) and Caspari-Sadeghi (2022), early signs of disengagement can be detected, enabling personalized support strategies. Karademir et al. (2021) highlight the use of success rate intervals to provide additional resources for struggling students, while Herodotou et al. (2020) confirm the positive impact of such interventions on course progress and completion rates.
Predictive analytics is another vital application of LA, focusing on early identification of students at risk of failing (Chatti et al., 2012; Banihashem et al., 2022). Broos et al. (2020) developed models to predict exam performance and identify at-risk students, while Sharif & Atif (2024) emphasize the role of predictive analytics in future pedagogical strategies.
Furthermore, LA supports personalized and adaptive learning environments, catering to individual student needs to maximize academic potential (Berland et al., 2014; Schumacher & Ifenthaler, 2018a). By offering immediate feedback through automated analysis of digital activities, LA enhances self-regulated learning processes, fostering autonomy and deeper engagement (Durall & Gros, 2014; Virkus et al., 2023). Despite its potential, integrating students' needs into LA system designs remains a challenge (Galaige et al., 2022). However, the insights provided by LA form a robust foundation for lecturers to critically evaluate and refine their pedagogical practices, supporting ongoing professional development and future course improvements (Ifenthaler, 2020).
Scenario Description with KlickerUZH
In KlickerUZH, learning analytics allow both lecturers and students to gain insight into the learning behavior and success of their class and/or themselves.For lecturers, different dashboards provide insight into the activity, progress, and performance of an entire class. For students, analytics focus on their achievement of competencies and mastery in specific quizzes and topics of a course. Learning analytics are anonymized and shown in aggregate to ensure the privacy of individual students. An example of a future learning analytics dashboard is shown below.
The three types of analytics for lecturers are the following:
- Activity Analytics: These visualizations aim to offer a comprehensive view of how students interact with the course materials, enabling lecturers to tailor their teaching strategies accordingly. They display the activity of students across the semester and highlight the changes from week to week.

Example illustration from the KlickerUZH activity dashboard - Progress and Performance Analytics: These visualizations offer lecturers insights into course progress, students' knowledge levels across various course topics, and individual student performance. They supports lecturers in identifying areas where students excel or may need additional support, facilitating targeted interventions.
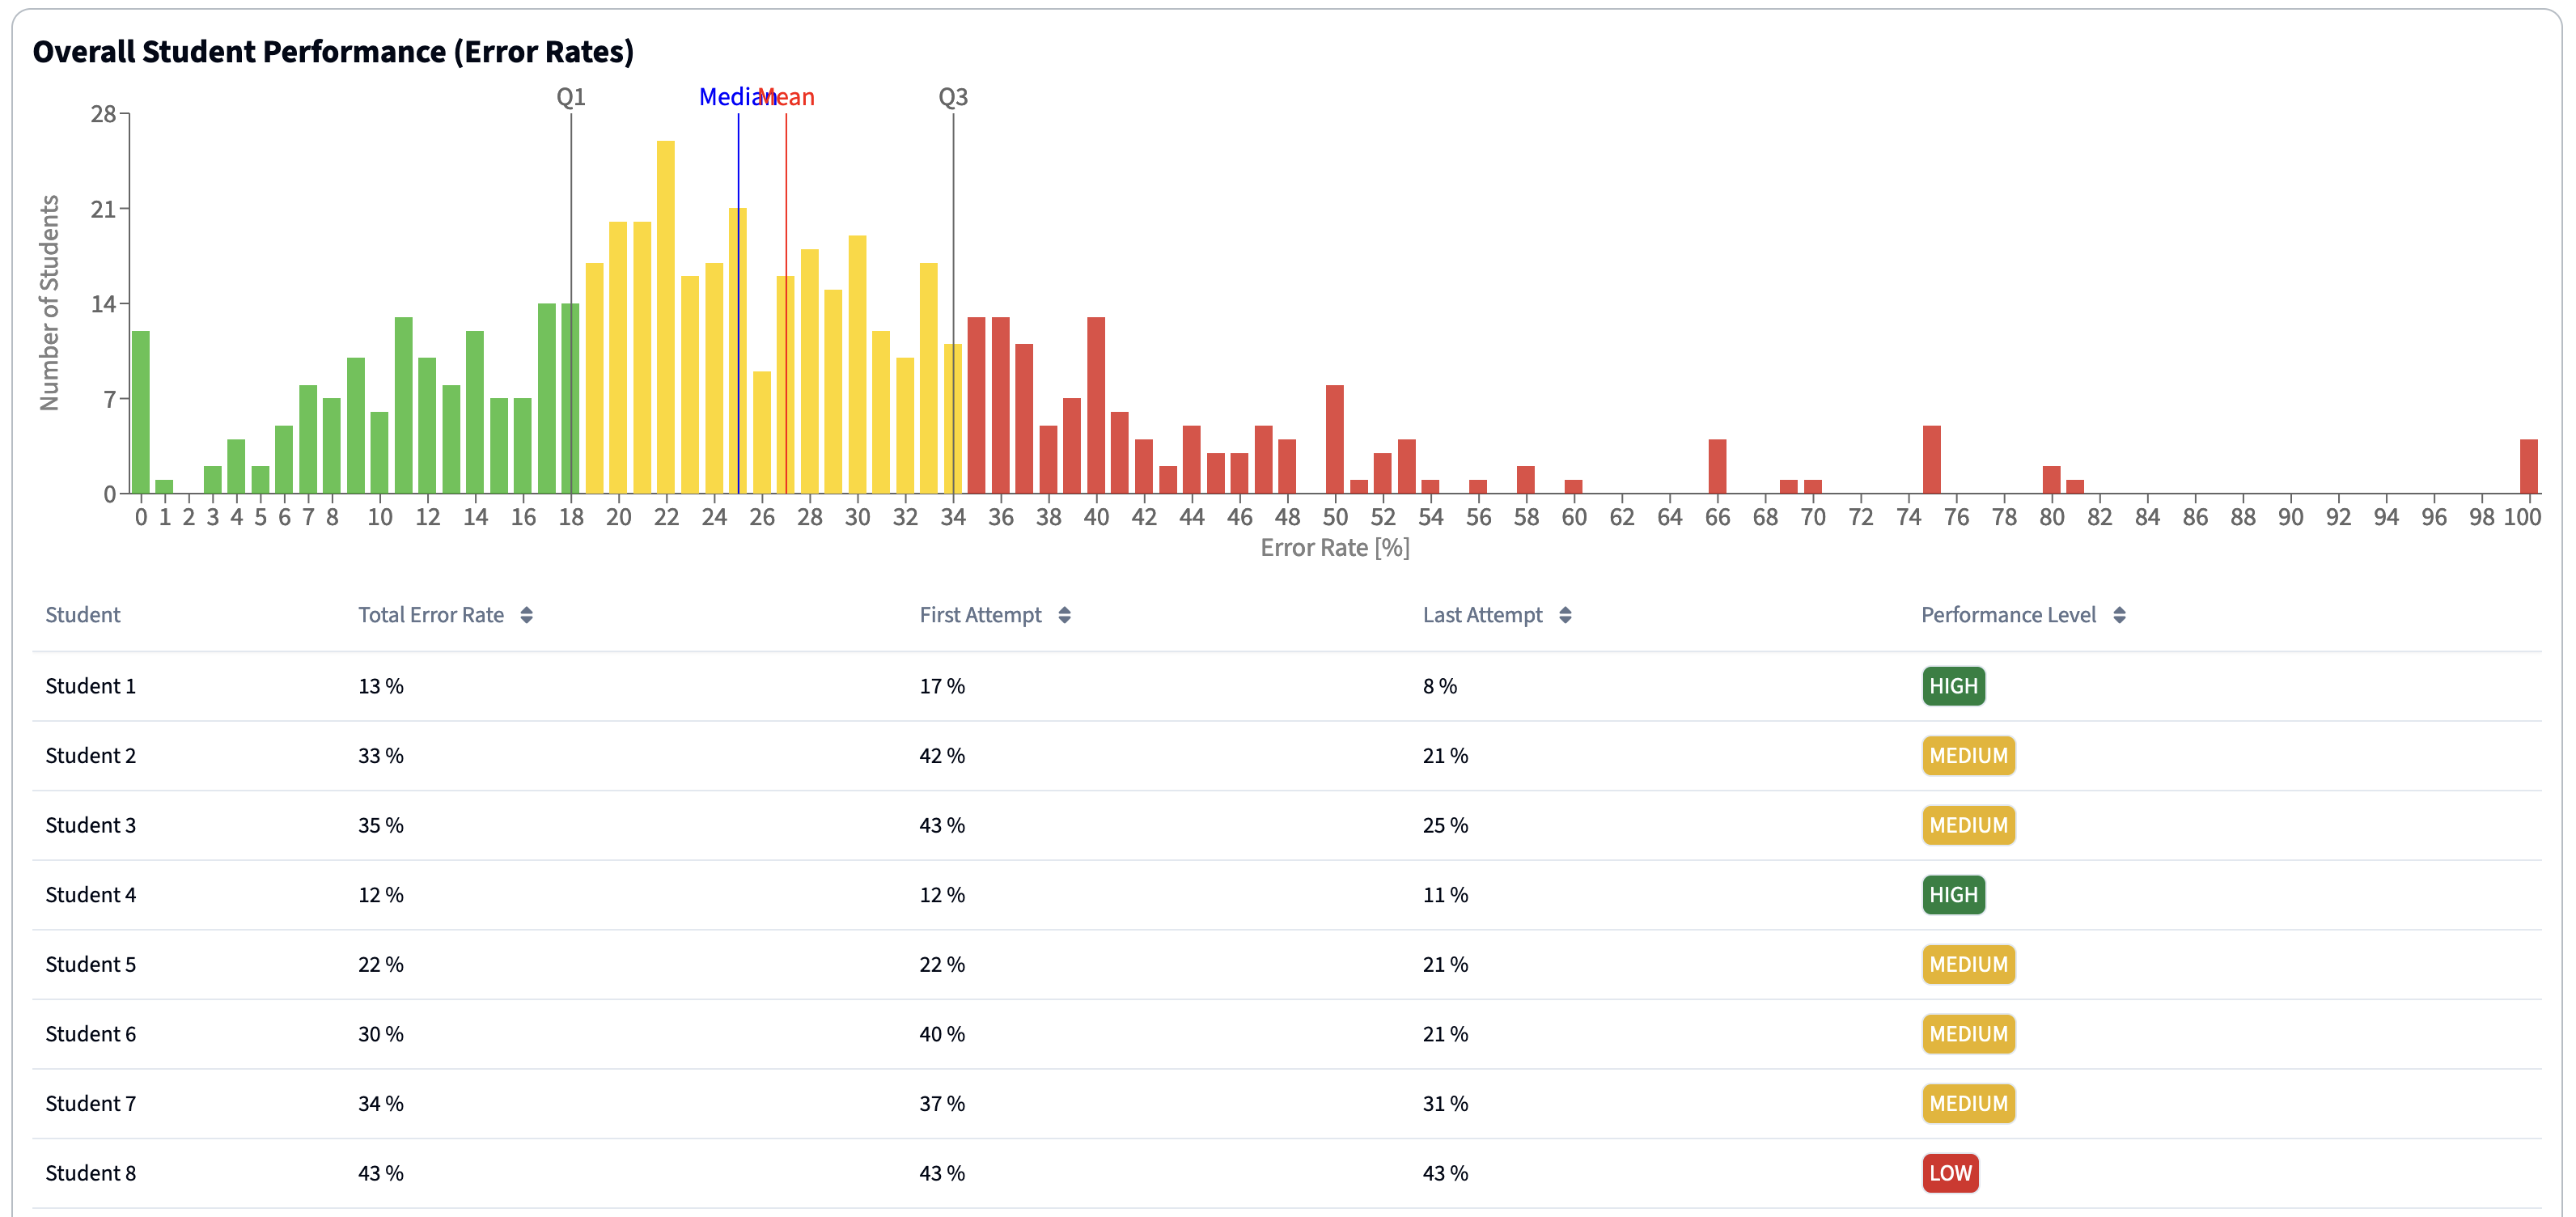
Example illustration of the KlickerUZH performance dashboard - Quiz Performance Analytics: Survey results indicate that lecturers have the greatest interest in analyzing quiz results. Quiz performance analytics include an overview of error rates, student feedback on quizzes, and detailed views of aggregated quiz results and individual quiz questions. This enables lecturers to gain a deeper understanding of student performance and refine their assessment strategies.

Example illustration of the KlickerUZH quiz dashboard
Our Learnings
Our preliminary research on implementing Learning Analytics in KlickerUZH has yielded substantial initial insights. These findings emerge from two complementary sources: a comprehensive survey (n=11) with lecturers and teaching assistants from various disciplines and the methodological challenges encountered during the development of the LA.
To systematically validate and further extend these findings, we will conduct comprehensive pilot studies during the spring term of 2025. Should you be interested in participating, please fill out the form at https://forms.office.com/e/K8CXM2pKhJ so that we may contact you. The results of the piloting will be evaluated and summarized as part of this use case.
- Understanding familiarity and application of learning analytics: The survey revealed varying levels of familiarity and implementation of Learning Analytics (LA) among lecturers. Task completion rate analysis was successfully used by 18.18% of participants, with 63.64% expressing interest in future adoption. Despite some unfamiliarity, the concept's potential is widely recognized, highlighting an opportunity for broader implementation.
- Adoption trends in quiz result analysis: According to the survey, quiz result analysis showed higher adoption, with 36.36% of lecturers already using it and 45.45% interested in future application. While behavior analytics and interaction time analysis have yet to be integrated, they garnered significant interest, indicating a readiness to explore these tools to enhance teaching practices.
- Growing interest in learning analytics tools: According to the survey, there is a strong interest in adopting LA tools if they are more accessible, particularly through platforms like KlickerUZH. This suggests a growing recognition of LA's value in providing deeper insights into student performance and engagement, which can inform and improve educational strategies.
- Ensuring data availability and quality: The effectiveness of LA as a data-driven approach to improving education heavily depends on the quantity, quality, and relevance of the data collected. An identified limitation is the inability to track offline learning activities (e.g. reading a book or even a printed PDF script), which are not captured by digital tools. This gap can lead to incomplete representations of student engagement and hinder accurate predictions. Rets et al. (2021) suggest incorporating features to log offline study efforts in LA dashboards to enhance the accuracy of predictive analytics. If this is not possible or done, it is essential for lecturers to critically evaluate the data, recognizing that it encompasses only online activities and may not fully capture offline learning efforts. Being aware of these limitations allows educators to interpret the data more accurately and make informed decisions that consider the entire learning context.
- Ethical considerations and data privacy: Beyond technical challenges and limitations, the ethical and legal dimensions of data collection and usage play a pivotal role in LA adoption. Privacy concerns, data protection, and the lack of transparency in data usage have been widely debated (Ferguson et al., 2016; Khalil & Ebner, 2015; Pardo & Siemens, 2014). Addressing these concerns requires not only robust anonymization but also careful validation of data to ensure its relevance and reliability (Ifenthaler, 2015; Seufert et al., 2020).